Getting clients is hard,
Let Google bring them to you!
Your competitors spend thousands on ads & SEO agencies. Get ahead, and let customers find you naturally in Google search results.
With 
The simple, automated process:
Add Your Website (5 minutes)
Seobot analyzes your business, competitors, and niche to find the highest-potential keywords.
Get Content Plan for a Month in Seconds
Seobot then turns found keyword into a full content calendar. Optimized to deliver the content that is loved both by humans and Google.
Get Traffic on Autopilot
Seobot works quietly behind the scenes - researching, writing, optimizing, and publishing. You can focus on growing your business, instead of manually writing articles.

Manual Content Creation
Expensive, and inconsistent way:
- ❌Wasting hours figuring out what to write about
- ❌You still don’t know which content actually bring clients
- ❌Freelancers vanish, agencies overcharge and underdeliver
- ❌You start writing… then stop. Then forget about it
- ❌Content is slow, inconsistent, or never gets published
- ❌You’re stuck on page 10 of Google, wondering what went wrong
- ❌Hiring someone = another monthly bill, still no clarity
I built SeoBot because
I needed it too

Three years ago, I launched a small online product.
We built a great thing - but no one was finding us.
I tried everything. Hired freelancers, paid agencies.
Got reports, audits, "technical fixes", but 0 traffic.
I just wanted something that works - without wasting hours on micromanagement.
So I built it. For myself.
That's how SeoBot started.
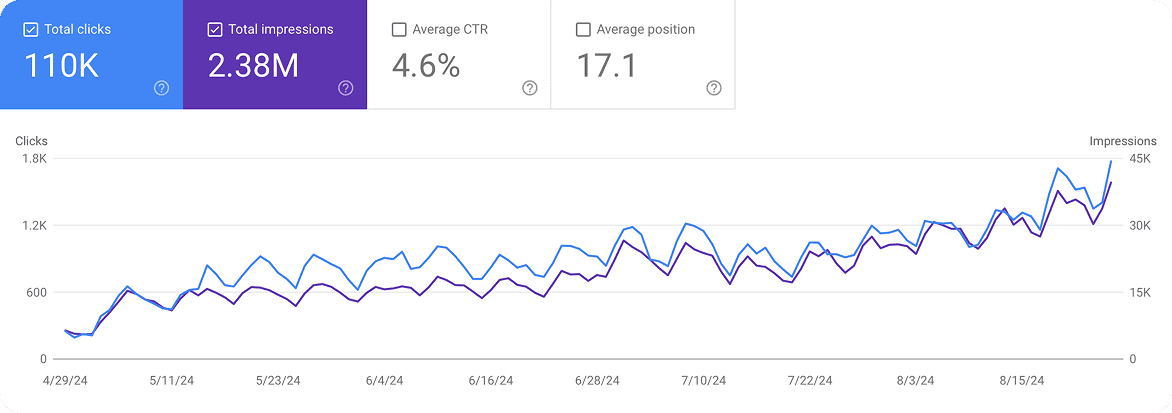
and the result is...

Content Examples
Seobot packs each article with useful info, pictures, and trusted sources.
How to Understand and Reduce Customer Churn
How to Grow Your Brand and Sell on Reddit
Why Your Facebook Ads Get Rejected (And How to Fix It)

How to Understand and Reduce Customer Churn
Customer churn analytics is the process of analyzing customer data to understand when, why, and how customers stop using your product or service. It goes far beyond simply counting lost customers - it's about uncovering the patterns and signals that predict future departures.
"Basic churn tracking is like counting how many people leave a party. Churn analytics is like understanding why they left, who's likely to leave next, and what you can do to make them stay."
This matters because the economics are compelling. Reducing customer acquisition costs by 5-25% while improving retention can increase profits by 25-95%. Instead of constantly chasing new customers, churn analytics helps you keep the ones you already have - and they're often your most valuable asset.
Why Customer Churn Analytics Matters More Than Ever

Acquiring new customers costs 5-7 times more than keeping existing ones, yet most companies still obsess over getting new customers. Today's business world makes this even harder - advertising costs keep rising, competition is everywhere, and customers can switch brands with a single click.
Traditional methods just don't work anymore. Most customers don't complain - they simply disappear without warning. When 80% of customers give no feedback when they leave, exit surveys become almost pointless. Looking at basic churn rates is like checking your rearview mirror while heading straight for a cliff.
But analytics turns this around completely. You can spot customers who might leave 60-90 days before it actually happens and save 15-30% of those at-risk relationships. This isn't just having better numbers - it's playing a totally different game where you rescue customers before they even know they're thinking about leaving.
Pro tip: 44% of companies focus on getting new customers while only 18% focus on keeping current ones. Switching these priorities could completely change your business results.
Key Metrics That Drive Churn Analytics

Smart customer churn analytics isn't about tracking everything - it's about tracking the right things. These six key metrics work as your early warning system for customer departure, giving you the power to act before it's too late.
The Essential Metrics You Need
| Metric | What It Shows | Why It Matters |
|---|---|---|
| Customer Churn Rate | Percentage of customers lost in a time period | Your baseline - shows how big your problem is |
| Customer Lifetime Value | Total expected revenue from each customer | High-value customers leaving hurts way more |
| Net Revenue Retention | How much revenue you keep and grow from existing customers | Shows if you're growing despite some churn |
| Product Usage Metrics | Login frequency, feature use, session time | The secret: no engagement = 90% chance of leaving |
| Customer Health Score | Combined metric of usage, support, and engagement | Your customer's vital signs - predicts churn with 85-95% accuracy |
| Support Ticket Volume | Number and type of support requests | Reveals trouble through complaints OR sudden silence |
What Each Metric Really Tells You
Customer Churn Rate is your starting point. It shows what percentage of customers you're losing each month or quarter. Think of it as taking your business temperature - if it's running high, you need to figure out why fast.
Customer Lifetime Value (CLV) helps you understand which customers matter most. When someone who brings in $10,000 a year leaves, that hurts way more than losing a $100 customer. Good CLV for SaaS companies runs 3-5 times their yearly contract value.
Net Revenue Retention shows the bigger picture. Even if some customers leave, are the remaining ones buying more? Top companies keep growing their revenue from existing customers by 120% or more each year.
Product Usage Metrics are your secret weapon. These track things like:
- How often people log in
- Which features they actually use
- How long they spend in your product
Here's the key insight: customers who don't engage within 30 days have a 90% chance of leaving within 90 days.
Customer Health Score combines everything into one simple number. Think of it like checking someone's vital signs at the doctor. Companies using health scores can predict churn with 85-95% accuracy because it looks at the whole picture, not just one piece.
Support Ticket Volume tells two stories. Rising complaints obviously signal trouble, but sudden silence can be even worse - it often means customers have given up and are already looking elsewhere.
How to Use These Metrics
The magic happens when you look at these metrics together, not alone. A customer might have great usage numbers but a terrible support experience. Or they might love your product but never use advanced features that could make them stick.
Start simple with 3-4 metrics that matter most to your business. You can always add more later, but beginning with too many just creates confusion and delays action.
How to Set Up Your Churn Analytics Process
Setting up customer churn analytics doesn't have to be complicated. Here's a simple, proven approach that you can start using right away to catch customers before they leave.
Building Your Churn Analytics System
Step 1: Define What "Leaving" Means for Your Business
First, you need to be crystal clear about what counts as churn. This isn't as obvious as it sounds. A SaaS company might count someone as churned when they cancel their subscription. But an ecommerce business might define it as 90 days without a purchase, or 120 days for luxury items.
Your churn definition drives everything else in your system, so spend time getting this right. Different businesses need different definitions based on their customer behavior patterns.
Step 2: Gather the Right Customer Information
You need data from multiple places to get the full picture:
- Product usage data - How often people log in, which features they use, how long they stay
- Billing information - Payment history, subscription changes, failed charges
- Support interactions - Tickets submitted, response times, problem types
- Survey responses - Satisfaction scores, feedback, complaints
The key insight: 73% of churn prediction accuracy comes from usage patterns tracked consistently over weeks or months, not one-time snapshots. Focus on trends over time, not single moments.
Step 3: Spot the Warning Signs Early
Look for behavior changes that happen 30-90 days before customers typically leave. Common warning signals include:
| Warning Sign | What It Looks Like | Why It Matters |
|---|---|---|
| Declining Usage | Fewer logins, shorter sessions | Shows decreasing engagement |
| Feature Abandonment | Stopped using key features | May indicate value isn't clear |
| Support Spike | Multiple tickets in short time | Suggests growing frustration |
| Payment Issues | Failed charges, downgrade requests | Often leads to involuntary churn |
| Competitor Research | Visiting competitor sites | Intent to switch providers |
These behavioral changes often show up months before customers actually leave, giving you time to act.
Step 4: Group Customers by Risk Level
Instead of treating all customers the same, group them into categories:
- High Risk - Multiple warning signs, immediate attention needed
- Medium Risk - Some concerning behavior, monitor closely
- Low Risk - Healthy usage patterns, focus on growth
This lets you create different approaches for each group instead of using the same strategy for everyone.
Step 5: Set Up Smart Alerts
Create automatic notifications when customers show warning signs. The magic is in acting fast - companies with automated churn alerts reduce churn by an average of 15% because early action works best.
Set up alerts for things like:
- Login frequency drops below normal levels
- Support tickets increase dramatically
- Product usage falls to warning thresholds
- Payment issues or subscription changes
Making It Work in Practice
Start simple with basic alerts and a few key metrics. You can always add more complexity later. The goal is to move from reactive (discovering churn after it happens) to proactive (preventing it before it occurs).
Remember, the best churn analytics system is one your team actually uses. Keep it simple, focused, and actionable from day one.
Churno.ai: Transform Your Churn Analytics
Reduce Customer Churn with Churno.ai
Building an effective churn analytics process can completely change how you keep customers, but having the right tools makes all the difference. Churno.ai helps you predict and prevent customer churn using advanced AI technology. It connects easily with your current data systems without any hassle.
Our AI-driven analysis spots early warning signals well before customers actually leave. You get automated alerts in real-time when customers show signs they might churn, so you can step in quickly. The platform works with your existing tools, making setup simple and straightforward.
Start improving your customer retention today: Sign up for Churno.ai →
How to Understand and Reduce Customer Churn
How to Grow Your Brand and Sell on Reddit
Why Your Facebook Ads Get Rejected (And How to Fix It)
Save Time & Money
Stop paying for tools, freelancers, and agencies that don’t deliver.
No missed deadlines or low-quality drafts. Seobot delivers fresh content every day.
Don’t waste hours trying to figure out what to write - focus on your business instead.
Use one platform for everything:
- Finds low-competition opportunities
- Creates a monthly content plan for your website
- Writes and updates SEO articles automatically
- Adds YouTube videos, images, tables, and more
- Publishes content to your website without spending your time
Built for small businesses
Priced for them too
I built Seobot for myself
I couldn't get traffic to my own website.
I hired agencies and freelancers - but got no results.
So I built something simple that works.
Seobot writes and publishes useful content every day.
Now it brings consistent traffic to my products.
Subscriptions start at.